Businesses with blogs generate more leads. Nearly half of consumers interact with content 3-5 times before talking to sales. Content engagement analytics helps you track these interactions. You can see what works and what doesn’t.
Many marketers look at page views. They ignore the metrics that actually matter. Website engagement means tracking bounce rates and session time. It means watching user behavior patterns.
Analytics help you understand your audience better. This guide shows you how to measure engagement effectively. You’ll learn which tools to use. You’ll discover how to turn data into action.
What is Content Engagement Analytics and Why It Matters
Understanding content engagement analytics
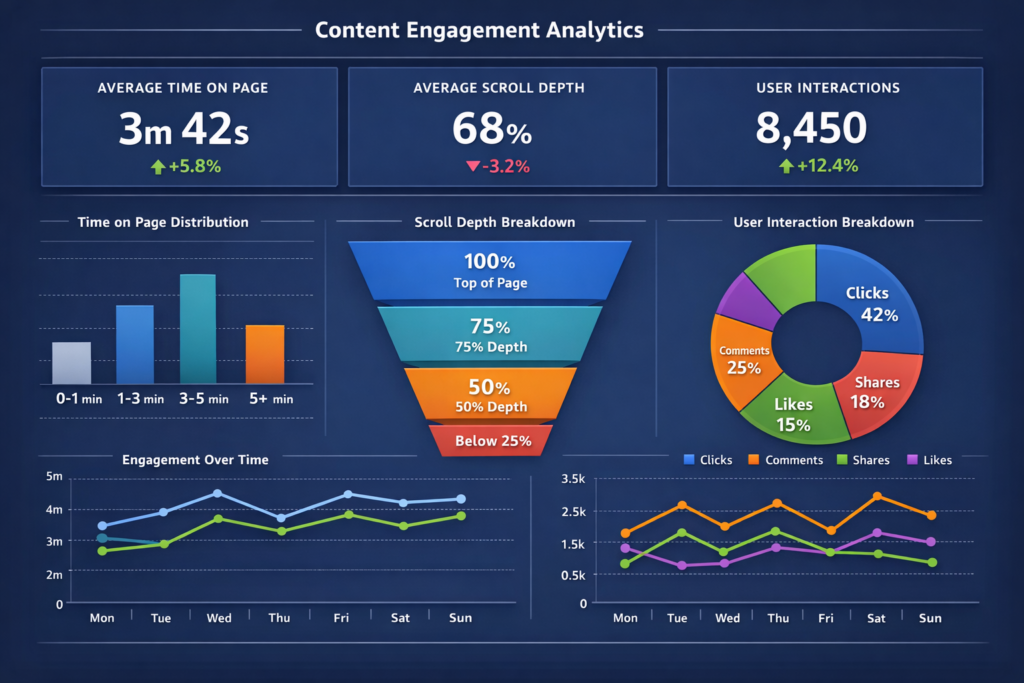
Content engagement analytics tracks user interactions with your content. This includes likes, shares, comments, and clicks. It measures view duration and other actions. These actions show active consumption of your content.
Every user action creates a trackable moment. These moments provide valuable insights. They guide visitors toward desired actions. View counts just show anonymous numbers. Engagement analytics reveals who interacts with your content. You see where they live. You understand why they find your message interesting.
The business impact of tracking engagement
Relying on intuition makes competition difficult. Data-driven insights transform guessing into knowing. This drives growth and audience connection. About 53% of marketers track social media engagement. Another 53% monitor website engagement.
Amazon’s recommendation algorithms drive 35% of purchases. Netflix uses engagement data to understand viewing habits. Their churn rate stays remarkably low at just 2%.
Key benefits of engagement analytics
Content engagement analytics delivers several advantages. Engaged content ranks higher on search engines. It performs better on social platforms. High engagement moves users down the sales funnel. This leads to sign-ups, downloads, or purchases.
Regular engagement creates loyal customers. These customers become brand advocates. Comments and interactions reveal what your audience values. You discover areas for improvement. Engaged customers stay subscribed longer. They continue using your product.
Key Engagement Metrics You Should Track
The right metrics separate meaningful data from noise. Each metric reveals different user behaviors.
Time on page and session duration
Time on page measures visitor duration on one page. Session duration tracks total time across your website. Longer times usually indicate higher engagement. Context matters though. Short time on a help page might mean quick answers.
Scroll depth and content consumption
Scroll depth shows how far users scroll down. It’s measured in percentages like 25%, 50%, or 75%. For blog posts, 75% scroll depth is good performance. This reveals whether users consume your content completely. Or they abandon it early.
Click-through rate (CTR)
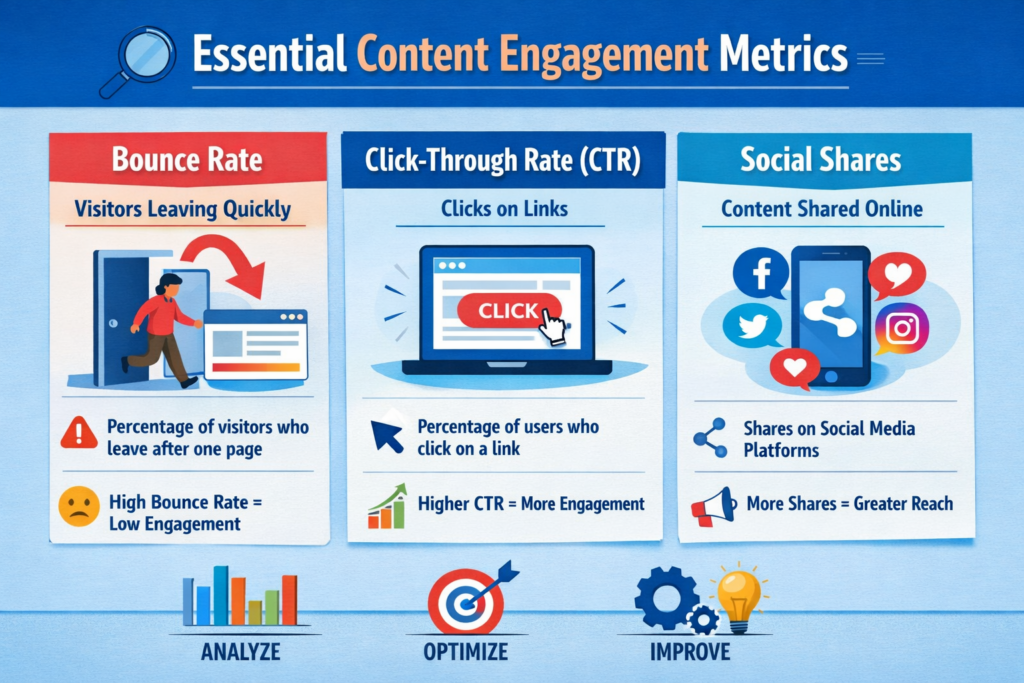
CTR measures the percentage who click links. It tracks call-to-action performance. Calculate it by dividing clicks by impressions. Then multiply by 100. Average CTR is 6.64% for search. Display ads average 0.57%.
Bounce rate and exit rate
Bounce rate tracks single-page visitors who leave. Exit rate shows where users leave during sessions. All bounces are exits. But not all exits are bounces.
Social shares and comments
Shares indicate content worth passing along. Comments signal deeper engagement. Writing requires more effort than simple likes. These interactions reveal what resonates.
Conversion rate from content
Conversion rate measures desired action completion. This includes purchases or form submissions. Calculate it by dividing conversions by total visitors. Then multiply by 100. This shows content’s direct business impact.
Page views and unique visitors
Page views count total page loads. This includes repeat visits. Unique visitors show different people viewing your content. This distinction helps you understand reach versus repeat engagement.
Video engagement and interaction metrics
Video completion rate shows percentage watching until end. If 1,000 viewers started and 700 finished, completion is 70%. Watch time measures total minutes spent viewing. This signals genuine interest.
How to Set Up Content Engagement Tracking
Proper tracking transforms raw data into actionable insights. The process requires multiple tools working together.
Installing Google Analytics for engagement tracking
Create a Google Analytics 4 property. Log into your account. Click the Admin section. Enter your property name. Select your reporting time zone and currency. Click Next.
Add a web data stream. Enter your website URL and stream name. You’ll receive a measurement ID starting with “G-“. This connects your site to GA4. Install the tracking code. Paste the Google tag snippet after the tag. Do this on every page.
Data collection begins within 30 minutes. Verify using the Realtime report.
Setting up custom events and goals
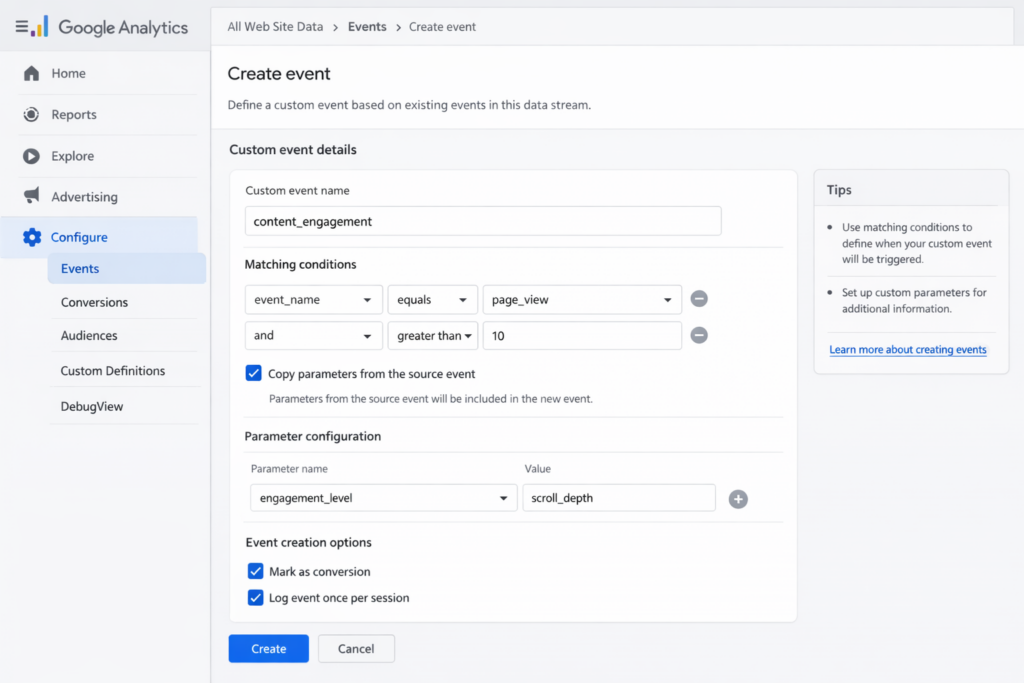
Custom events track specific interactions. GA4 doesn’t capture these automatically. Use the gtag() function to send events. Specify the event command, event name, and parameters.
Track form submissions by creating a “thank_you” event. This triggers when users land on confirmation pages. Place the gtag() function below your Google tag snippet. You can also create events without code. Do this directly in the GA4 interface.
Implementing heatmap and scroll tracking tools
Heatmaps visualize where users click. Intense colors show high activity areas. To implement in Hotjar, sign up first. Add the JavaScript tracking snippet to your website. Use Google Tag Manager or add directly to code.
Create a new heatmap project. Select your sample size. 2,000 pageviews is recommended. Specify the URL. Wait one week to collect sufficient data. Scroll maps automatically track visitor scroll depth. This provides insights into content consumption.
Configuring UTM parameters for campaign tracking
UTM parameters are tags added to URLs. They identify which campaigns refer traffic. Always use utm_source, utm_medium, and utm_campaign together.
Example summer email campaign URL: https://www.example.com/?utm_source=summer-mailer&utm_medium=email&utm_campaign=summer-sale
Separate parameters from the URL with a question mark. Connect multiple parameters with ampersands. Use Google’s Campaign URL Builder. This generates tagged links automatically. Never use UTM codes on internal links. They confuse Google Analytics and create tracking errors.
Common tracking mistakes to avoid
Focus on specific goals and metrics. Don’t track everything. Missing or duplicated tracking codes prevent data collection. Ensure code appears on every page in the section.
Without event tracking and UTM parameters, you can’t determine campaign effectiveness. Avoid data sampling by shortening date ranges. Minimize filters in custom reports. Don’t focus only on static monthly reports. You’ll miss short-term traffic surges and campaign opportunities.
Analyzing Engagement Data: What to Look For
Reading your engagement dashboard correctly
Your dashboard displays three critical components. Highlights show snapshot metrics for your timeframe. Top-performing content appears based on algorithms. These consider plays, unique viewers, and view duration.
Insights sections surface interesting data points. Study engagement trends using graphs. These track player impressions, plays, and unique viewers. They show minutes viewed and average drop-off rates. Hover over data points for detailed breakdowns.
The engagement funnel visualizes the viewer journey. It tracks discovery through complete consumption.
Identifying red flags in your data
Sudden follower drops signal content misalignment. They indicate over-promotional posts. Declining engagement rates mean content stopped resonating. Watch for fake followers. They distort analytics and undermine credibility.
Short session durations suggest navigation problems. Or insufficient engaging content. Low feature usage reveals overlooked UI elements. These require better placement. Spikes in complaints demand immediate attention. Negative reviews signal deep dissatisfaction.
Understanding engagement benchmarks by industry
Good engagement rates fall between 1% and 5%. Benchmarks vary by platform and industry. TikTok maintains higher engagement at 3.70%. Instagram averages 0.48%.
Fashion and entertainment see higher rates than finance. The median website engagement rate reached 56.21% in September 2024. Automotive posted the highest engagement at 61.48%. Health & Wellness followed at 61.74%.
Comparing engagement across different content types
Video content receives the highest engagement rates. Live videos generate 6x more interactions than regular posts. Blog posts perform optimally at 1,200-1,800 words.
Interactive features boost engagement significantly. This includes calculators and comparison tools. Track these patterns by monitoring time on page. Watch scroll depth and conversion rates. Identify your top performers across different formats.
5 Actionable Strategies to Improve Content Engagement
Raw data means nothing without action. These five strategies transform metrics into business growth.
Strategy 1: Optimize content structure for scannability
Research shows 79% of people scan web pages. Only 16% read word-for-word. Break large text blocks into short paragraphs. Use 2-4 sentences maximum.
Use white space between paragraphs and sections. This reduces visual clutter. Apply visual hierarchy through bold text and headings. Use bullet points to highlight key information. This lowers bounce rates. It increases time on page.
Strategy 2: Use interactive elements and multimedia
Interactive content generates 4-5x more pageviews than static content. Add quizzes, polls, and calculators to your pages. Include interactive infographics.
These elements transform passive readers into active participants. Users remember interactive experiences better. They require engagement rather than passive consumption.
Strategy 3: Personalize content based on user behavior
Dynamic personalization results in a 1.3X uplift in conversions. Swap images based on referral source. Change recommendations based on browsing history. Adjust CTAs accordingly.
Send triggered messages after cart abandonment. Base messages on lifecycle stage. Segment customers by behavior, geography, and demographics. Deliver relevant experiences.
Strategy 4: Improve page load speed and mobile experience
Research indicates 53% of visits get abandoned. This happens if pages take longer than 3 seconds. Compress images using WebP formats. Enable lazy loading.
Minify CSS and JavaScript files. Mobile accounts for 62.22% of global internet traffic. Test performance on mobile devices first. Use tools like PageSpeed Insights.
Strategy 5: A/B test headlines and CTAs regularly
A/B testing transforms conversations from ‘we think’ to ‘we know’. It generates statistically significant results. Create two headline versions. Split your audience to determine which performs better.
Test CTA placement, button colors, and copy. Run tests long enough to gather meaningful data. Then implement winning variations. This boosts analytics consistently.
Top Content Engagement Analytics Tools in 2026
Selecting the right platform determines whether data delivers insights or confusion. Each tool serves different tracking needs.
Google Analytics 4 for comprehensive tracking
GA4 collects event-based data from websites and apps. It uses machine learning to predict user behavior. The platform provides predictive capabilities without complex models. It integrates directly with media platforms.
Google Analytics remains free for small businesses. Analytics 360 costs $150,000 annually for enterprise features.
Hotjar for heatmaps and user recordings
Trusted by 1,306,323 websites across 180+ countries. Hotjar visualizes user behavior through heatmaps. It provides session recordings.
The platform now includes AI summaries. It has error detection after joining Contentsquare. Pricing starts at $39 monthly for the Plus plan.
Mouseflow for behavior analytics
Mouseflow serves 210,000+ digital experience users worldwide. The platform uses AI-driven insights through Mina AI. This identifies UX issues. It includes automatic friction scoring.
Session replay connects with journey analytics. This shows where users drop off.
SEMrush for content performance insights
SEMrush analyzes data from 808 million domains. It tracks 26.4 billion keywords and 43 trillion backlinks. The platform monitors organic traffic and keyword rankings. It measures content effectiveness.
Pricing ranges from $119 to $449 monthly.
Mixpanel for advanced user analytics
Mixpanel tracks user actions. This includes clicks, sign-ups, and feature usage. The platform creates user cohorts. It measures retention patterns.
Session Replay shows exactly how users interact. You see real product usage.
Choosing the right tool for your needs
Match tools to your specific goals. Use GA4 for broad website tracking. Choose Hotjar for visual behavior analysis. Select Mixpanel for product-focused user analytics.
Conclusion
Content engagement analytics transforms guesswork into strategy. It reveals exactly how users interact with content. Vanity metrics like page views provide surface-level data. Tracking the right engagement metrics shows what drives conversions. It builds loyalty.
Start by implementing proper tracking tools. Focus on metrics that align with business goals. Test different content formats. Optimize for user behavior. Use the insights to refine your strategy continuously.
When you measure what truly matters, results improve. You’ll see better engagement rates. You’ll see stronger bottom-line results.
FAQs
Q1. What are the most important metrics for measuring content engagement?
The most critical metrics include session duration and click-through rates. Track conversion rates, scroll depth, and social interactions. Monitor shares and comments. Additionally, tracking bounce rates helps. So does time on page and form submissions. These provide valuable insights into user interactions. They show whether content drives desired actions.
Q2. How can I track content engagement on my website?
Install Google Analytics 4 to monitor user behavior. Set up custom events and goals. These track specific interactions. Implement heatmap tools to visualize user activity. Configure UTM parameters to track campaign performance. These tools work together. They capture comprehensive engagement data across your website.
Q3. What is considered a good engagement rate for content?
Generally, engagement rates between 1% and 5% are good. This varies by platform and industry. TikTok averages 3.70% engagement. Instagram sees around 0.48%. Website engagement rates across industries median at 56.21%. Sectors like automotive perform higher. Health & wellness averages around 61%.
Q4. What’s the difference between bounce rate and exit rate?
Bounce rate measures visitors who leave after viewing one page. They have no interaction. Exit rate shows the percentage leaving from a specific page. This happens during a multi-step session. All bounces are exits. But not all exits are bounces. Users may visit multiple pages before exiting.
Q5. Which tools are best for analyzing content engagement in 2026?
Top tools include Google Analytics 4 for comprehensive tracking. Hotjar provides heatmaps and user recordings. Mouseflow offers behavior analytics with AI-driven insights. SEMrush analyzes content performance. Mixpanel delivers advanced user analytics. Choose tools based on specific needs. Use GA4 for broad tracking. Pick Hotjar for visual analysis. Select Mixpanel for product-focused insights.