Tired of jumping between five different tools just to pull your SEO data together?
Your Google Data Studio SEO report fixes that problem. This free platform pulls information from multiple sources into one place. You get faster reports with clear visuals of your rankings, traffic, and conversions.
Better yet, automation handles the heavy lifting. Set it up once and your SEO dashboard updates itself. No more manual exports or spreadsheet nightmares.
This guide shows you how to build a dashboard that actually works. You’ll connect data sources, track metrics that matter, and create reports that drive real decisions.
What is Google Data Studio (Looker Studio) for SEO Reporting
The Platform Basics
Google renamed Data Studio to Looker Studio recently. Don’t let that confuse you—it’s the same tool. You get a web-based reporting platform that connects to multiple data sources.
The platform works natively with Google Search Console, Google Analytics, and BigQuery. You can tap into over 800 data sources through partner connectors. Third-party tools like Semrush and Ahrefs plug in seamlessly too.
Your data comes together in one dashboard. No coding required. The drag-and-drop interface makes building reports straightforward.
Why SEO Professionals Love It
Your SEO data lives scattered across platforms. Looker Studio centralizes everything. You track keyword rankings, organic traffic, and backlink profiles simultaneously.
Real-time updates keep your reports current. You skip manual refreshes. The platform automatically pulls fresh information from connected sources.
White-labeling adds your branding to reports. Clients see your logo and colors instead of generic templates. This professionalism strengthens your presentation.
Automated email delivery saves hours weekly. Schedule reports daily, weekly, or monthly. Stakeholders receive updates without you lifting a finger.
Why Choose This Over Paid Alternatives
The price matters most. Looker Studio offers a free version. Pro features cost just $9 per user per project monthly.
Most BI tools charge hundreds upfront. You get robust functionality at zero cost. Teams test the platform risk-free before upgrading.
Essential SEO Metrics to Track in Your Dashboard
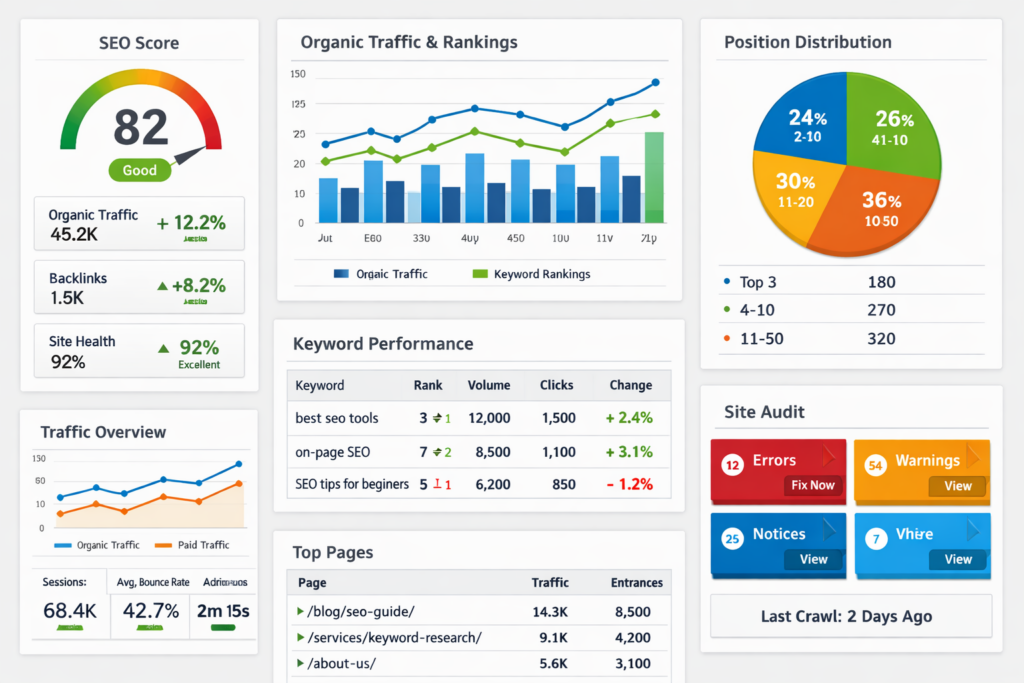
Your SEO dashboard needs the right metrics. Track these eight areas to measure performance accurately.
Organic Traffic and Sessions
Organic sessions count visitors arriving from search engines. Rising sessions prove your content ranks better. Declining traffic signals competition or technical problems. You get steady inbound demand without paying per click.
Keyword Rankings and Average Position
Rankings show where your pages appear for search terms. Position influences impressions, CTR, and traffic. Lower average positions indicate higher quality and authority.
Click-Through Rate (CTR)
CTR divides total clicks by impressions. Position one averages 39.6% CTR. Position two drops to 18.4%. Strong CTR proves your titles and descriptions persuade searchers.
Impressions and Visibility
Impressions track how often your site appears in search results. Rising impressions suggest better targeting before traffic increases appear. You need visibility to generate clicks.
Conversion Goals and Revenue
Conversions measure income tied to search traffic. This metric links SEO directly to business results. Track organic visitor actions like purchases and lead forms.
Bounce Rate and Engagement Metrics
GA4 counts engaged sessions lasting over 10 seconds. Bounce rate shows the inverse percentage. Low engagement means content doesn’t match search intent.
Backlink Profile Data
Monitor referring domains and link quality over time. Links remain ranking factors. Track growth to identify opportunities.
Page Speed and Technical SEO Metrics
Core Web Vitals measure loading, interactivity, and stability. Pages meeting thresholds rank better. Speed affects conversions directly.
How to Connect Data Sources to Your SEO Report
Connecting data sources builds the foundation. Follow these five steps to integrate everything properly.
Step 1: Access Looker Studio and Create New Report
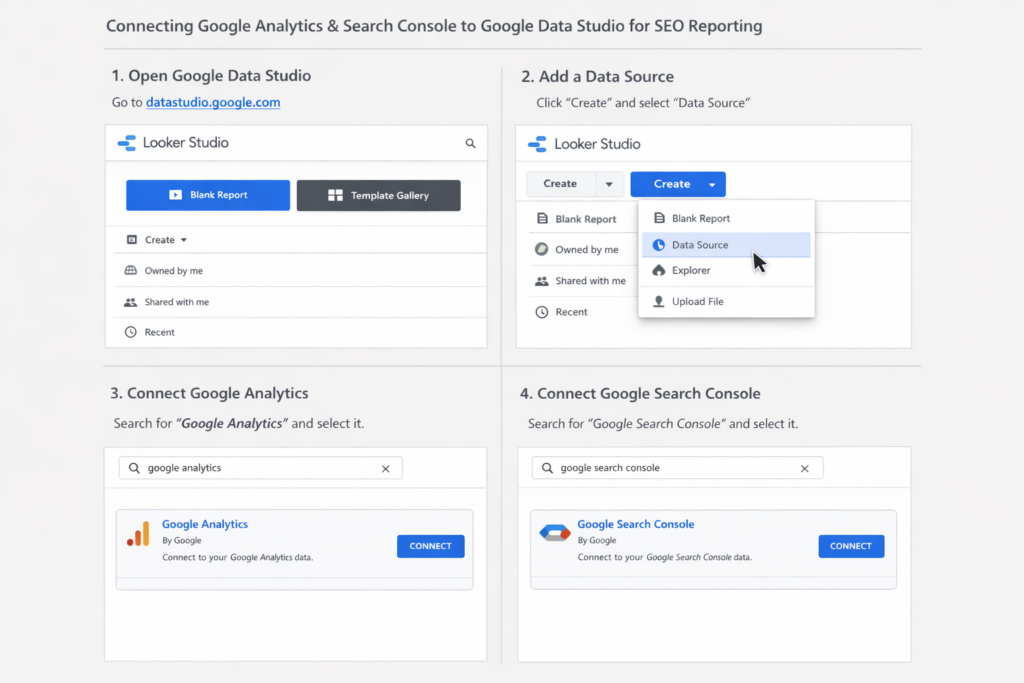
Sign in to Looker Studio at lookerstudio.google.com. Click Create and select Report. The Add data to report panel opens. Choose Connect to data for new sources. Select My data sources to reuse existing connections.
Step 2: Connect Google Search Console
Click Add Data and search for Search Console. Click Authorize and grant access. Choose your site property and select your data type. Pick your search type like Web, Image, or Video. Click Add to connect. URL Impression works best for tracking individual page performance.
Step 3: Integrate Google Analytics 4
Select Google Analytics from the connector list. Choose your GA4 property and connect it. The platform filters data automatically to show Session source = google and Session medium = organic. This focuses your report on search traffic only.
Step 4: Add Third-Party Connectors (Semrush, Ahrefs)
Semrush connectors require a Guru or Business tier subscription. Ahrefs needs an Advanced plan or higher. Search for your connector and authorize both accounts. Select report parameters like domain and database. Site Explorer consumes credits per chart.
Step 5: Configure Data Source Parameters
Parameters make your reports flexible. Define them using setAllowOverride(true) in connector settings. Report editors modify values through the properties panel. Report viewers adjust parameters via URL using encoded JSON strings. Avoid making parameters overridable when they affect schema or contain sensitive data.
Building Your First Google Data Studio SEO Report: Step-by-Step
Building your first google data studio seo report takes six clear steps.
Step 1: Start with a Blank Report Template
Open Looker Studio and select Blank Report. The Add data to report panel appears automatically. You skip templates to maintain full control.
Step 2: Add Your Primary Data Sources
Click Add and select Google Analytics first. Choose your GA4 property. Next, add Google Search Console. You now have both sources connected.
Step 3: Insert Basic Charts and Scorecards
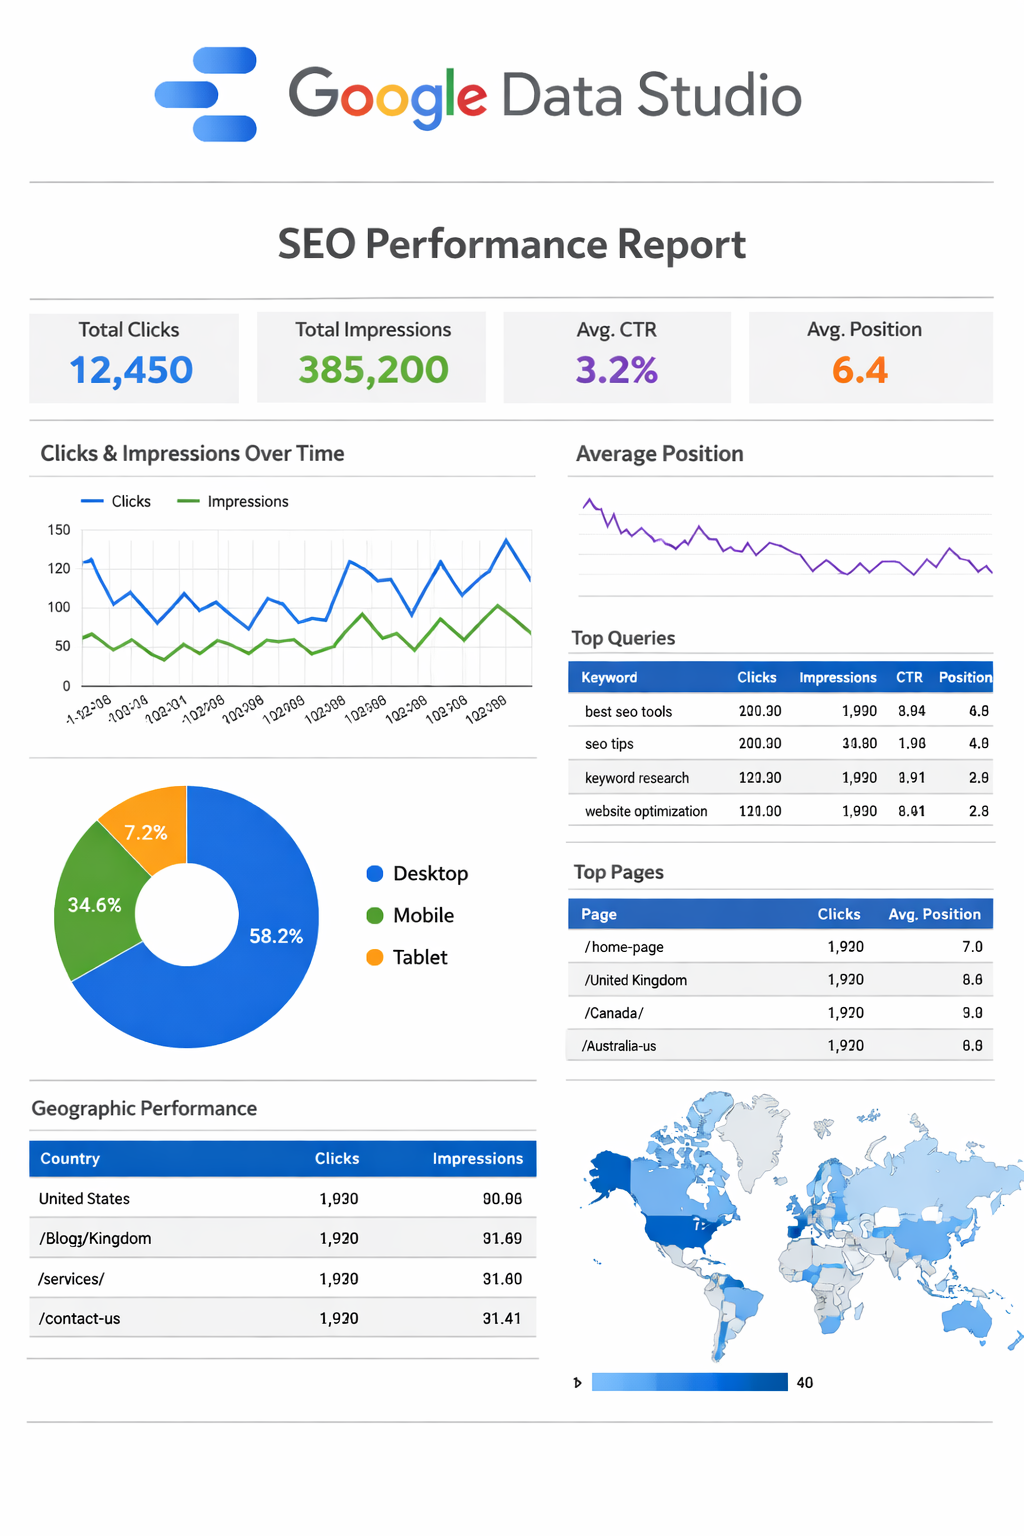
Add scorecards to display key metrics like organic sessions, total clicks, and average CTR. Scorecards show single numbers perfectly for KPIs. Insert a time series chart to visualize clicks over time. Add a table showing top search queries with impressions, clicks, and position columns. Include a donut chart for device category breakdown.
Step 4: Organize Dashboard Layout for Clarity
Place scorecards at the top as your KPI strip. Position time series charts in the middle section. Put detailed tables at the bottom. This creates logical flow from overview to granular data.
Step 5: Apply Filters and Date Controls
Add filters for organic traffic and specific URL patterns. Insert date range controls at the top right. Set charts to Auto date range so they respond to the control.
Step 6: Test Data Accuracy
Compare your dashboard numbers against GA4 and Search Console directly. Check that filters work correctly. Spot-check tables to catch dimension or metric errors. This prevents reporting bad data to stakeholders.
7 Must-Have Widgets for Your SEO Dashboard
Seven widgets transform your dashboard from basic to powerful.
1. Scorecards for Key Performance Indicators
Scorecards display single metrics prominently. Track 10-15 KPIs maximum to keep focus sharp. Show organic sessions, average position, and total clicks. Month-to-date and year-to-date comparisons reveal progress instantly.
2. Time Series Charts for Traffic Trends
Line charts visualize changes over weeks or months. You spot traffic growth patterns and ranking shifts effortlessly. These charts cut analysis time by 30% when formatted correctly.
3. Data Tables for Keyword Performance
Tables provide granular keyword data you can export to Excel. Filter by metrics like monthly search volume, CTR, and average position. View up to five ranking pages per tracked keyword.
4. Geographic Maps for Location Insights
Geo charts clarify global traffic patterns. You refine regional targeting strategies based on actual visitor locations. Mobile traffic accounts for 58% of visits, making location data vital.
5. Conversion Funnels for Goal Tracking
Funnels connect SEO efforts to revenue outcomes. Track organic visitor journeys from search to conversion.
6. Comparison Charts for Period Analysis
Period-over-period comparisons highlight quarterly or yearly growth. Year-over-year views identify seasonal trends and performance shifts.
7. Calculated Fields for Custom Metrics
Build custom formulas for conversion rates and profit margins. Calculate metrics like revenue per user automatically. These derived metrics answer specific business questions raw data cannot.
Advanced Tips: Automating and Customizing Your SEO Report
Automation transforms your google data studio seo report from manual to effortless.
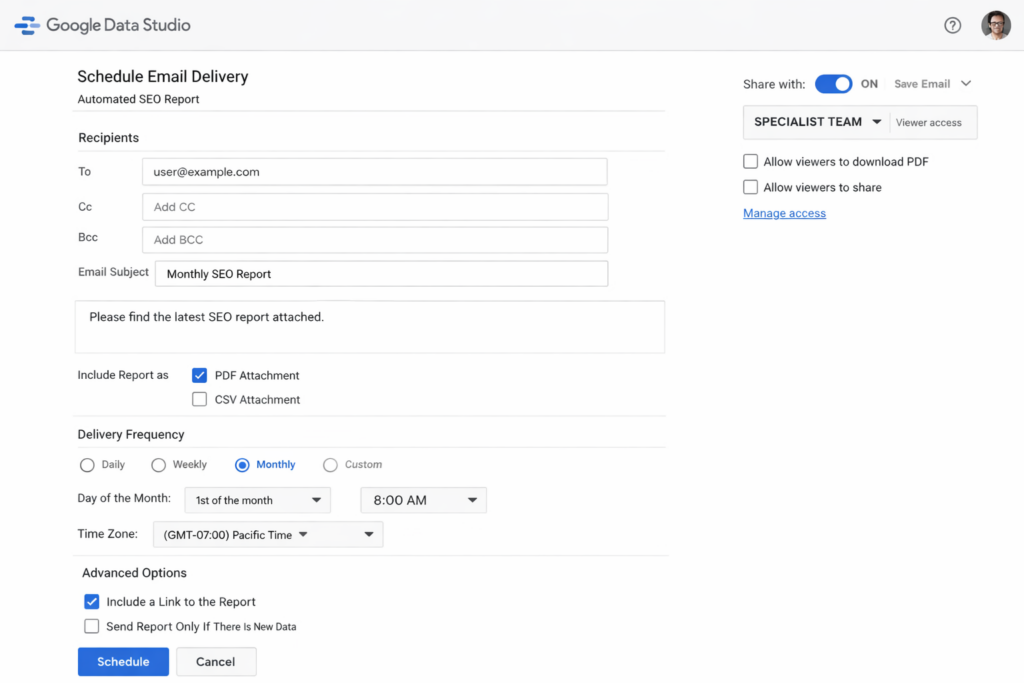
Setting Up Automated Email Delivery
Click the arrow next to Share and select Schedule email delivery. Add up to 50 recipients without requiring Google accounts. Choose daily, weekly, or monthly frequency. Customize your subject line and message. Select specific pages to include in the PDF attachment. The email contains a preview, PDF, and live report link. Test delivery before scheduling by clicking Send Now.
Creating Dynamic Date Range Controls
Navigate to Add a control and select Date range control. Place it at the top right of your report. Choose between fixed dates for specific campaigns or advanced ranges like Last 28 days. Enable comparison periods showing Previous period or Year-over-year data. Add comparison toggles at bottom left for easy switching.
Building Custom Filters for Segmentation
Apply filters at chart-level, page-level, or report-level depending on scope. Chart-level filters affect single visuals. Page-level filters apply to all charts on one page. Report-level filters span the entire dashboard. Name filters clearly using formats like Include — Source — Google Ads.
Designing Calculated Metrics and Fields
Create calculated fields at data source level for reusability. Click Resource, then Manage added data sources, then Add a field. Build conversion rates using formulas like total_orders / unique_visitors. Use CASE statements for customer segmentation based on order values. Avoid nested aggregations on existing metrics.
Adding Company Branding and Logos
Click the Image icon and upload PNG or SVG logos. Place logos in the top-left corner as natural anchor points. Select elements and Make report-level to appear on all pages. Customize colors through Theme and Layout in the sidebar. Adjust Component Background for main dashboard color. Set transparent backgrounds in Image Properties Style tab.
Sharing Reports with Stakeholders
Click Share to invite specific people or Google Groups. Turn on link sharing for broader organization access. Choose between public viewing or restricted access. Generate short URLs to embed in websites. Download reports as PDFs for offline distribution. Copy personal report links creating independent copies for specific viewers.
Common Mistakes to Avoid When Creating SEO Dashboards
Six mistakes sabotage your seo dashboard before launch.
Overloading Your Dashboard with Too Many Metrics
Most agencies limit KPIs to 10 or fewer. Cognitive overload happens when reports exceed this threshold. Clients struggle to identify important metrics. Your dashboard becomes noise instead of insight. Stick to actionable metrics only.
Ignoring Mobile Responsiveness
Mobile accounts for 58% of search traffic. Your dashboard must work on smartphones. Test on actual devices, not just developer tools. Touch targets need 48×48 pixels minimum spacing. Prioritize mobile designs from the start.
Not Setting Up Proper Data Filters
Filters segment traffic by source and type. Missing filters mix branded and non-branded searches. Organic and paid traffic blur together. Set report-level filters for consistent data views.
Mixing Incompatible Data Sources
Data blending creates mismatched values across platforms. Google Analytics and Search Console use different algorithms. Clicks don’t match sessions exactly. Normalize data before connecting sources. Verify timezone settings align.
Forgetting to Test Data Accuracy
Spot-check 2-3 key metrics monthly. Compare dashboard numbers against source platforms directly. Discrepancies exceeding 10% require investigation. Testing prevents reporting phantom performance changes.
Using Wrong Aggregation Methods
Non-additive aggregates like COUNTD fail in secondary data sources. Weighted averages differ from simple means. Choose aggregation methods matching your analysis goals.
Free Google Data Studio SEO Report Templates You Can Use
Pre-built templates accelerate your google data studio seo report creation. You skip hours of configuration work.
Basic SEO Performance Template
GA4 SEO templates track organic sessions, pageviews, and users. You analyze traffic trends and identify top-performing pages. These templates include visitor demographics like age, gender, device, and country. SE Ranking’s core SEO dashboard combines position tracking with Google Search Console data. The template monitors organic traffic, ranking positions, and search volume simultaneously.
Keyword Tracking Dashboard Template
Windsor.ai offers a free keyword rank tracking dashboard. The template shows keyword positions, CTR, clicks, and impressions from Search Console. SE Ranking’s rankings template displays keyword distribution across SERP positions. You view top 3, top 10, and top 30 rankings in one chart. Setup takes under two minutes with the Windsor.ai connector.
Technical SEO Monitoring Template
Coupler.io’s technical SEO dashboard analyzes URL health through status codes. The template tracks 200 URLs, 3xx redirects, and 4xx errors. You identify crawl errors by examining fetch and indexing states. Core Web Vitals appear for mobile and desktop separately.
How to Customize Templates for Your Needs
Access Looker Studio’s template gallery for starting points. Modify visual elements like colors, fonts, and layouts. Add your logo for white-label reporting. Integrate new data sources to match your tracking needs.
Conclusion
You now have everything needed to build a powerful google data studio seo report that centralizes your data. Connect your sources, track the right metrics, and automate delivery to save hours each week.
Avoid common mistakes like overloading dashboards or skipping mobile testing. Start with free templates if you need speed. Your SEO reporting transforms from scattered chaos to actionable insights.
Build your dashboard today and watch data clarity drive better decisions.
FAQs
1. What is the difference between Google Data Studio and Looker Studio?
There is no difference—they are the same platform. Google simply renamed Data Studio to Looker Studio, but the core functionality remains unchanged. It’s still a free web-based reporting tool that connects to multiple data sources for creating SEO dashboards and visualizations.
2. Can I use Looker Studio templates for free or do I need to pay?
Looker Studio itself is completely free to use, and many basic templates are available at no cost. However, some advanced or specialized templates created by third-party developers may be sold separately, typically ranging from $99 to $199. The platform also offers a Pro version at $9 per user per project per month for additional features.
3. How do I connect Google Search Console and Google Analytics to my SEO dashboard?
First, access Looker Studio and create a new report. Click “Add Data” and select Google Search Console, then authorize access and choose your site property. Next, add Google Analytics by selecting your GA4 property from the connector list. The platform will automatically filter to show organic search traffic from Google.
4. What are the most important SEO metrics to include in my dashboard?
Focus on organic traffic and sessions, keyword rankings and average position, click-through rate (CTR), impressions, conversion goals, bounce rate and engagement metrics, backlink profile data, and page speed metrics including Core Web Vitals. Limit your dashboard to 10-15 key performance indicators to avoid overwhelming viewers.
5. Can I automate my SEO reports to send automatically to clients?
Yes, you can set up automated email delivery in Looker Studio. Click the arrow next to “Share” and select “Schedule email delivery.” You can add up to 50 recipients and choose daily, weekly, or monthly frequency. The email will include a preview, PDF attachment, and link to the live report.