GA4 reports show thousands of metrics, but they rarely tell you what action to take. When Google replaced Universal Analytics in July 2023, every business moved to GA4. Yet most marketers still open it, see a wall of numbers, and leave without a clear decision.
The problem is not the data. GA4 reporting gives you more information than any previous analytics tool. The problem is that most GA4 reports show what happened — not what to do about it.
This guide focuses on six GA4 reports that change that. Each one answers a specific marketing question. Together, they tell you where to invest, what to fix, and where your funnel is leaking. And at the end, there is a free GA4 reporting dashboard template that tracks all of them in one place — no manual exports required.
Quick Summary: The 6 GA4 Reports That Drive Decisions
| GA4 Report | Key Metric | Marketing Decision It Drives |
| Traffic Acquisition | Sessions by channel + MoM change | Where to invest for traffic growth |
| User Acquisition | New users by first-touch source | Which channels build your audience |
| Engagement & Events | Engagement rate + avg engagement time | Which content to write more of |
| Conversion Report | Key event rate by page and channel | Where your funnel leaks |
| Funnel Exploration | Drop-off % at each stage | Which step to fix first |
| Path Exploration | Most common pre-conversion page sequences | Where to place your next CTA |
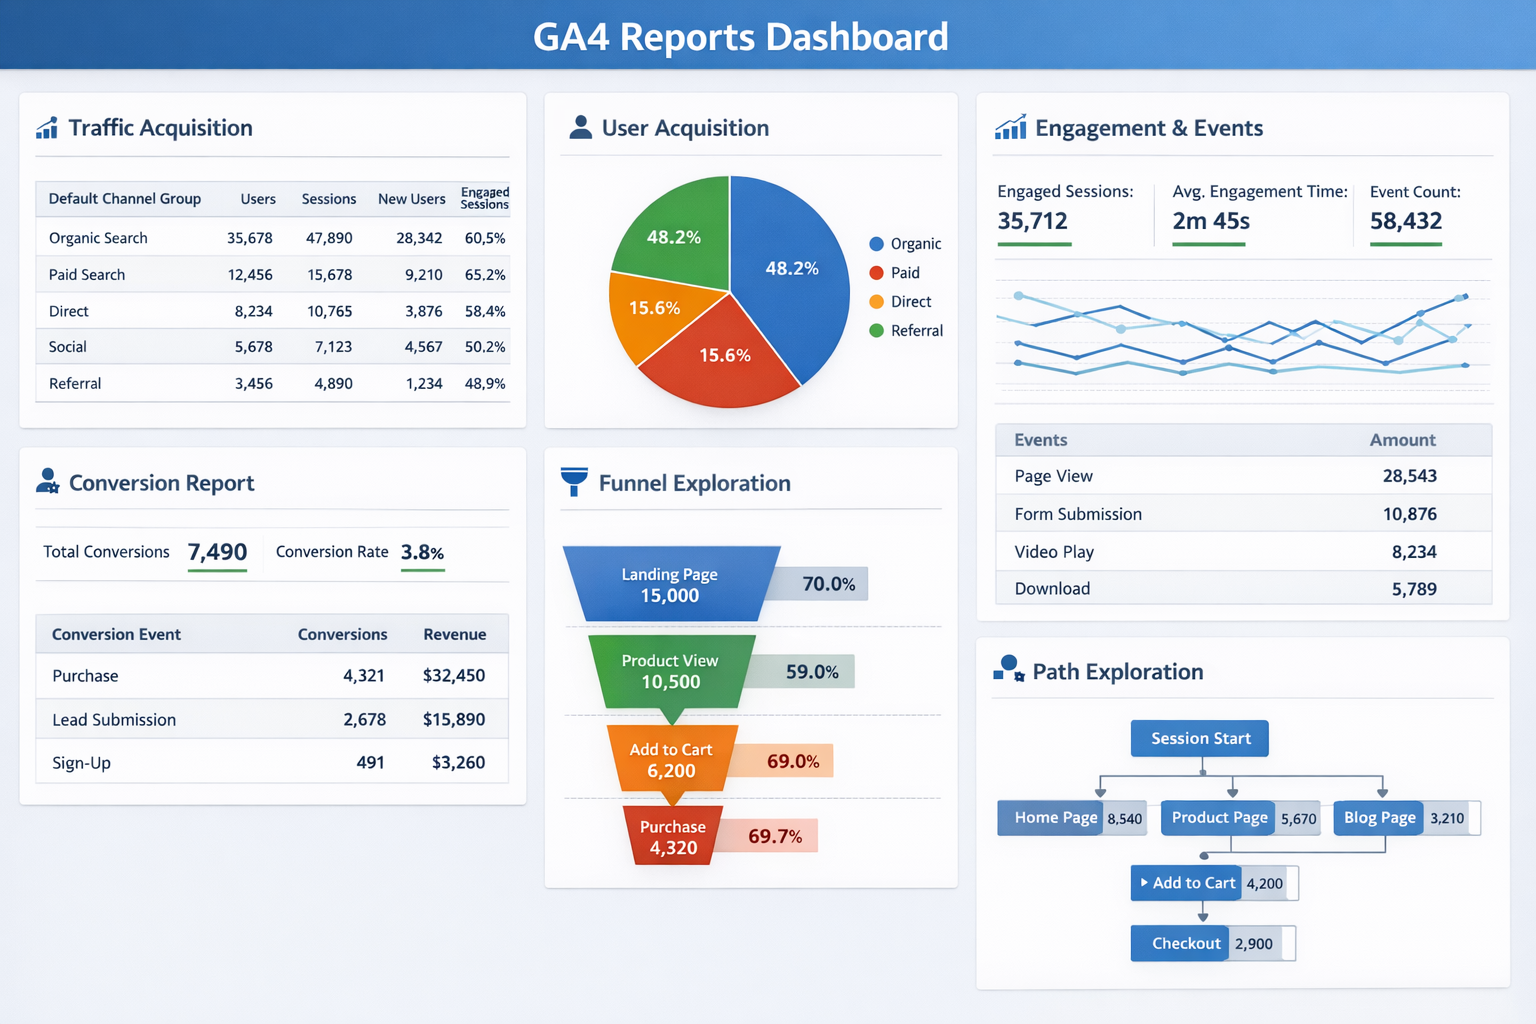
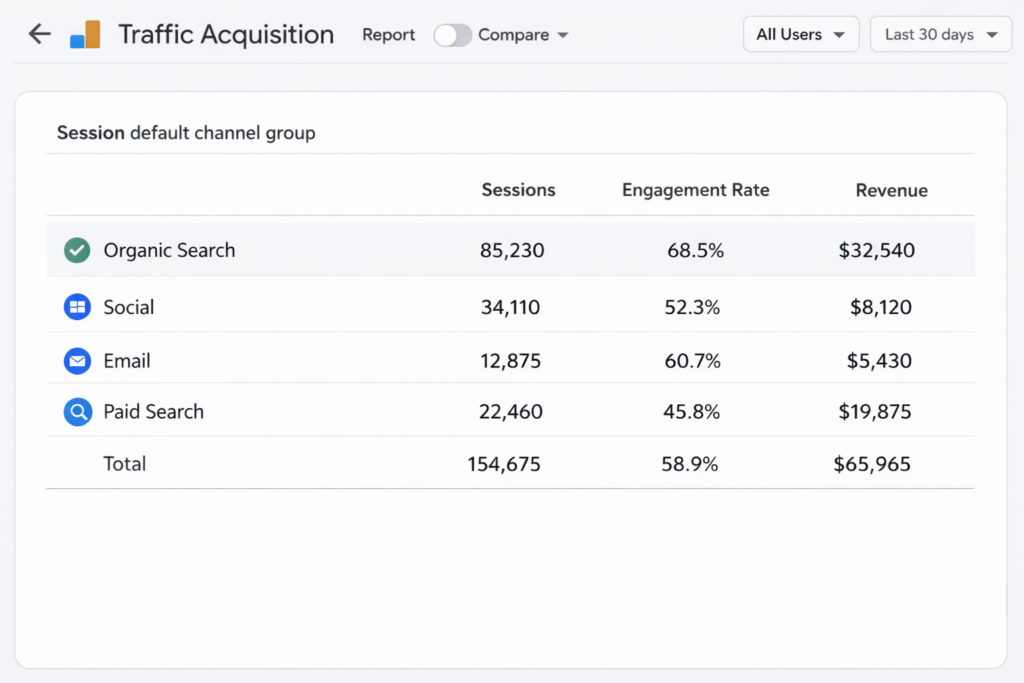
1. Traffic Acquisition Report
What it shows: This report shows how visitors find your site — broken down by channel. It covers Organic Search, Direct, Referral, Email, Social, Paid Search, and more. It operates on session scope, meaning every visit is counted separately, whether from a new or returning user.
Key metrics to watch
- Sessions by channel — which source drives the most visits
- Engagement rate per channel — which source brings quality traffic, not just volume
- Key event rate — which channel actually converts, not just clicks
- Revenue by channel — which source earns money, not just traffic
How it drives decisions: This report answers your most important budget question: which channels are earning their place? A site getting 80% of sessions from Organic Search looks healthy until a core update hits. Watching channel share monthly tells you when to diversify before you have to. Always sort by key event rate, not sessions — a channel with 500 sessions and $3,000 revenue is worth more than one with 5,000 sessions and $200.
Practical example: A marketing team notices Paid Social drives 15,000 sessions monthly with a 35% engagement rate. Email drives 3,000 sessions with 68% engagement and converts at 8.2% versus 2.1% for social. They reallocate 30% of social ad budget to email list building. Conversions increase despite lower total traffic.
| Pro Tip: Add device category as a secondary dimension. If mobile users engage at half the rate of desktop visitors on the same channel, you have a mobile experience problem — not a channel problem. Fix the page before cutting the budget. |
| Takeaway: If any channel drops more than 15% MoM, investigate before your next monthly report. GA4 reporting delays make problems look smaller than they are. Catch them early. |
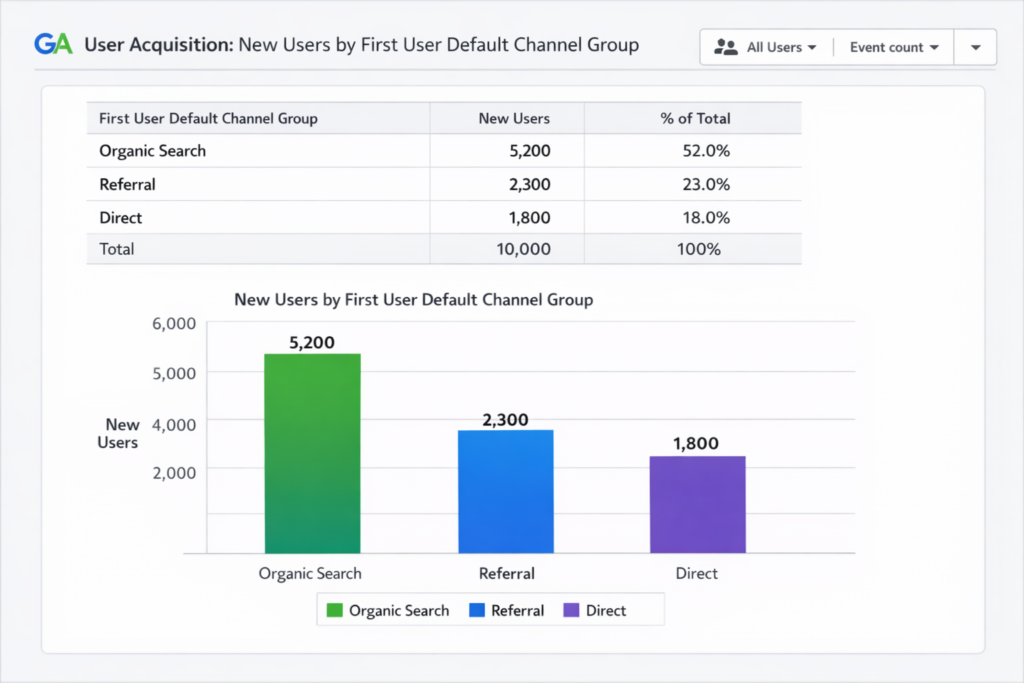
2. User Acquisition Report
What it shows: While Traffic Acquisition tracks every session, this report focuses on new users only — and attributes each one to the first channel that brought them to your site. That attribution stays permanent, regardless of how many times they return through other channels.
Key metrics to watch
- New users by first-touch source — which channel introduces people to your brand
- User engagement rate — are first-time visitors actually reading or bouncing?
- Key event rate by acquisition channel — which source brings converting visitors?
- New users trend MoM — is your audience growing or stagnating?
How it drives decisions: Traffic Acquisition tells you who comes back. User Acquisition tells you who you are reaching for the first time. A channel that looks weak in Traffic Acquisition might be your strongest new audience builder. Use both reports together: User Acquisition for growth strategy, Traffic Acquisition for retention and re-engagement strategy.
Practical example: A B2B company finds LinkedIn ads generate 800 new users monthly at 12% key event rate. Facebook delivers 4,200 new users at 2.8%. Total conversions favour Facebook (118 vs 96) but cost per acquisition tells a different story. They reallocate 60% of Facebook budget to LinkedIn and accept lower volume for higher-quality new users.
| Pro Tip: Cross-reference new user channels with your email subscriber growth. If Organic Search brings most new users but those users do not subscribe, you have a list-building gap on your top landing pages. A well-placed content upgrade on your highest organic pages fixes this fast. |
| Takeaway: Watch new user engagement rate closely. If it falls below 40%, you are attracting visitors who are not the right audience. That signals a content-channel mismatch — fix the targeting before scaling the spend. |
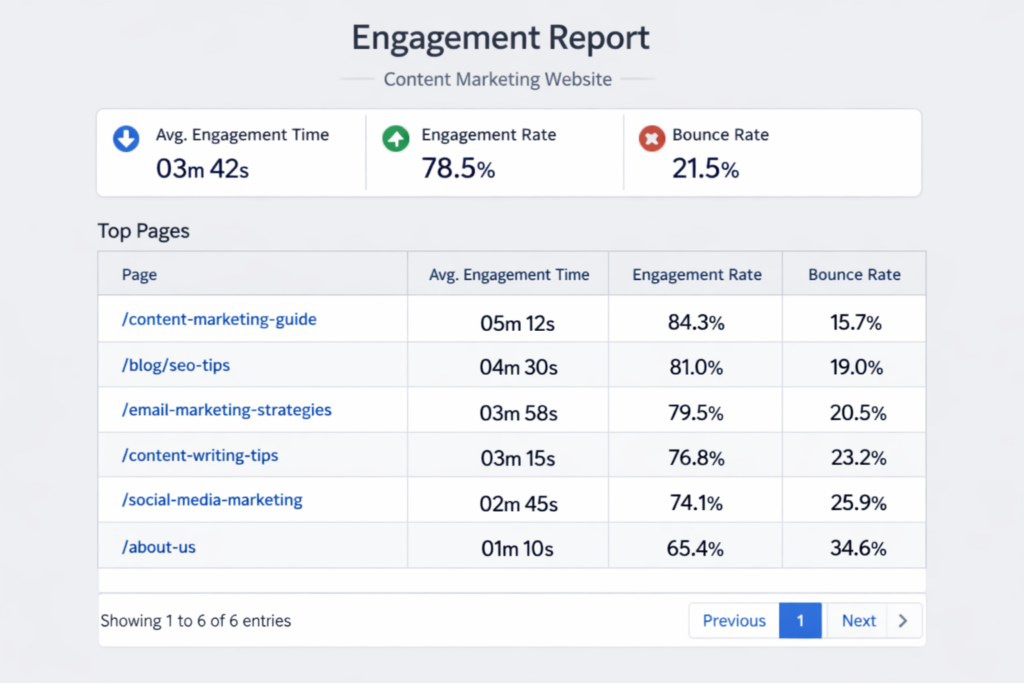
3. Engagement Report
What it shows: This report measures how people interact with your content. It tracks engagement rate, average engagement time, bounce rate, and event counts across the whole site and individual pages. GA4 defines an engaged session as one that lasts over 10 seconds, includes two or more pageviews, or triggers a key event..
Key metrics to watch
- Engagement rate — percentage of sessions that met the engaged threshold
- Average engagement time — how long visitors actively spent on your content
- Bounce rate — the inverse of engagement rate; always sum to 100%
- Top pages by engagement — which content actually holds attention
How it drives decisions: High traffic with low engagement means people are arriving and leaving immediately — a strong signal that your content does not match what your page title promised. The median engagement rate across industries sits at around 56%. If you are below 50% on your top-traffic pages, that is your content priority list. Pages with high traffic and low engagement already have the audience — they just need to serve them better.
Practical example: A blogger sees 3,200 sessions on a pillar post with 31% engagement rate and 42 seconds average engagement time. They rewrite the introduction, add a table of contents, and break up long paragraphs. The next month: 58% engagement rate, 112 seconds average time. Same traffic, far better reader experience and a 40% lift in email opt-ins.
| Pro Tip: Do not chase a high engagement rate on every page. A landing page built for a single CTA should have direct exits. Judge each page by its purpose. A 35% engagement rate on a squeeze page that converts at 12% is excellent. Context matters more than the benchmark. |
| Takeaway: Find pages with over 500 sessions and below 45% engagement rate. That combination is your highest-leverage content fix list. One improved page lifts your whole site average — and these pages already have the traffic. |
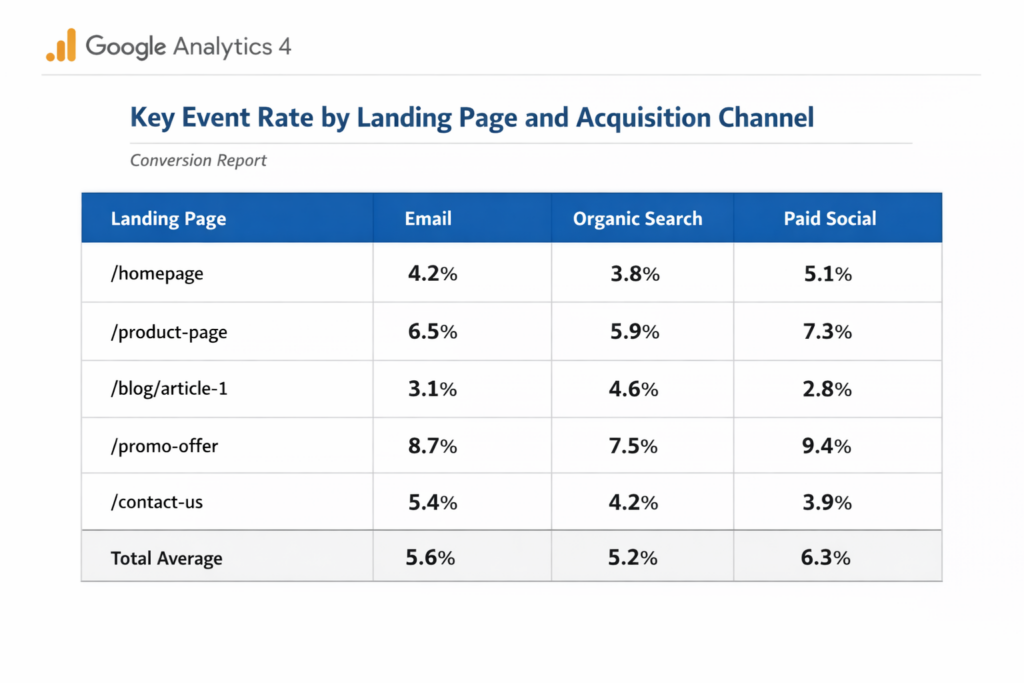
4. Conversion Report
What it shows: The GA4 conversion report shows how often your key events fire — email opt-ins, form submissions, purchases, downloads, or any goal you have configured. It breaks conversions down by event name, page, and source. In GA4, a conversion comes from marking any event as a key event in your Admin settings.
Key metrics to watch
- Key event rate by page — which pages convert visitors most effectively
- Key events by channel — which source drives the most goal completions
- Conversion trend — is your site getting better or worse at converting over time
- Revenue per conversion event — average value per goal completion
How it drives decisions: This report answers the question every marketer actually cares about: is the traffic doing anything useful? A page with 5,000 sessions and 12 key events is underperforming. A page with 400 sessions and 60 key events is a conversion machine worth studying. Cross-reference this with the Traffic Acquisition report to see which channels not only drive sessions but drive sessions that convert. Conversion metrics show where your content earns and where it wastes attention..
Practical example: An SEO specialist finds Organic Search drives 61% of sessions but only 38% of key events. Email drives 12% of sessions but 31% of key events. The data makes the case for prioritising email nurture over more SEO content in Q2. They build three new email sequences and increase total key events by 22% without adding a single new page.
| Pro Tip: Set up at least three key events before relying on this report: an email opt-in, a 50% scroll trigger, and a contact form or purchase. Without multiple conversion events, you are only seeing part of your funnel. GA4 does not track conversions that you have not told it to track. |
| Takeaway: Any page with over 500 sessions per month and below 2% key event rate has a fixable CTA problem. That is your conversion optimisation list. Start with the highest-traffic page and work down — each fix compounds. |
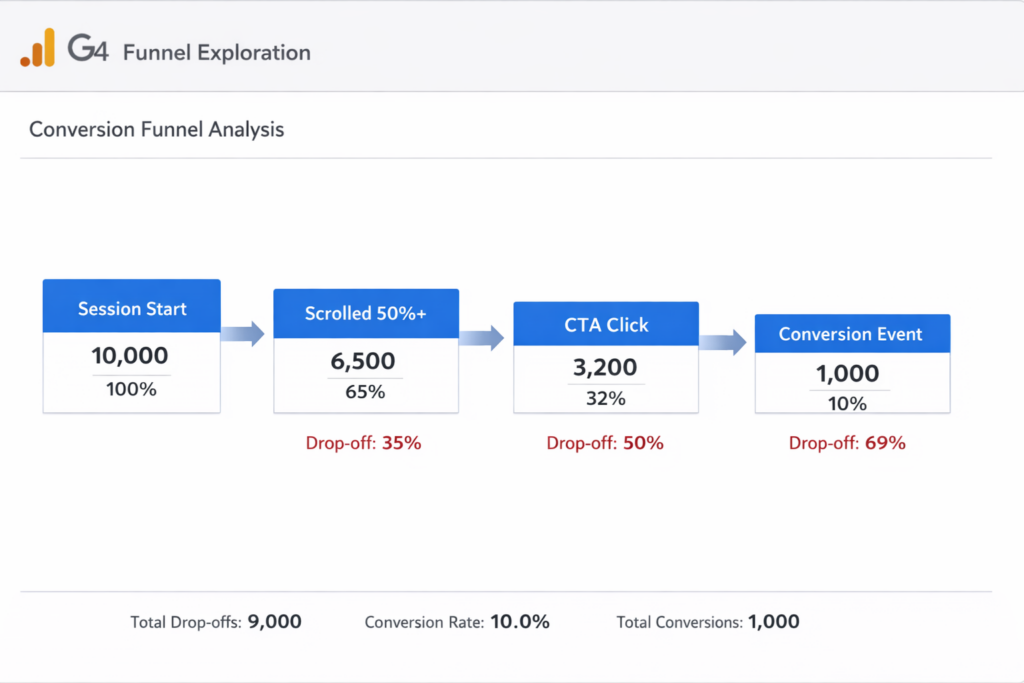
5. Funnel Exploration
What it shows: Found in the Explore section of GA4, Funnel Exploration lets you map the steps visitors take toward a conversion — and shows exactly where they leave. You define up to 10 stages. GA4 shows the drop-off rate at each one. Unlike standard GA4 reports, this one visualises the full conversion path.
Key metrics to watch
- Step-by-step drop-off rate — where exactly people leave your funnel
- Completion rate — how many people who start your funnel finish it
- Elapsed time between steps — where visitors stall or hesitate
- Segment comparisons — how new vs returning users behave at each step
How it drives decisions: Most conversion problems happen two or three steps before the final CTA — where visitors quietly leave without ever seeing the offer. Funnel Exploration shows you the exact step where attention breaks. Fix that step and you improve every conversion downstream. Add a breakdown by device category to find out if mobile users drop off at twice the rate of desktop — a common pattern that points to a mobile UX problem, not a messaging problem.
Practical example: A marketing consultant maps a four-stage funnel: Landing page → Scroll 50% → CTA click → Thank you page. They find 68% drop-off between the landing page and the scroll trigger. The problem is not the CTA. People are leaving before they reach it. They restructure the above-the-fold content to lead with the benefit. Drop-off falls to 44% the following month. Conversions increase 43%.
| Pro Tip: Build your funnel with at least four stages: session start, first scroll trigger (50%), CTA click, and conversion event. Two stages tells you almost nothing. Four stages tells you exactly where to focus your next optimisation sprint. |
| Takeaway: Funnel Exploration data in GA4 updates with a 24–48 hour delay. Review it weekly, not daily. A Monday morning check covering the prior week gives you clean, actionable patterns without the noise of daily fluctuations. |
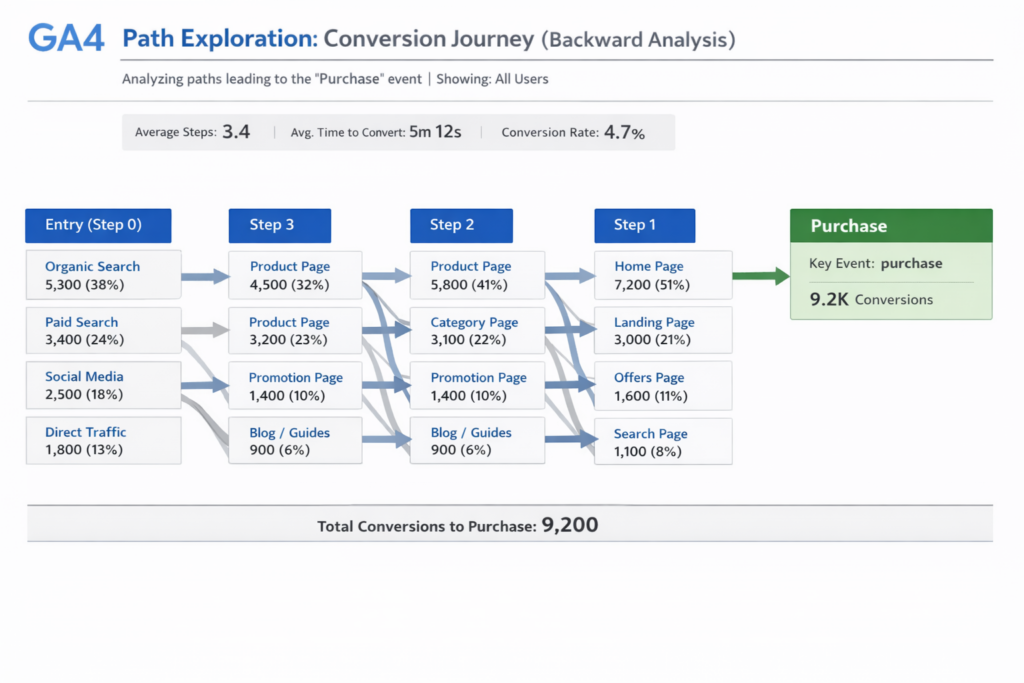
6. Path Exploration
What it shows: Also in the Explore section, Path Exploration maps the actual sequences of pages visitors navigate through your site. It reveals the most common journeys — where visitors go after landing, which paths lead to conversion, and where they exit. Unlike Funnel Exploration, it tracks real behaviour rather than steps you define..
Key metrics to watch
- Top paths from entry page — where visitors go after your most-visited pages
- Pre-conversion paths — which page sequences lead most reliably to a key event
- Exit pages — where visitors leave the site most often
- Loop patterns — pages users visit repeatedly, which signals confusion
How it drives decisions: Path Exploration answers the question no other GA4 report can: what journey do converting visitors actually take? Start from your key conversion event and trace backward — this reveals which pages appear in most converting journeys. Those pages are warm audience pages. Adding a relevant CTA or opt-in to them is one of the highest-ROI changes you can make without creating new content.
Practical example: A blogger uses backward path exploration starting from their email opt-in event. They discover visitors who subscribe almost always view the About page first — but the About page has no opt-in form. They add a content upgrade offer to the About page. Email conversions increase 34% the following month without any change to other pages.
| Pro Tip: Use Page path as your dimension rather than Page title. Titles can be duplicated or vague. The exact URL is always unambiguous and easier to act on when you go to make changes. |
| Takeaway: Map the top five paths that end in conversion and the top five that end in exit. The gap between those two journeys tells you exactly where to add internal links, CTAs, and content upgrades. That is a quarter’s worth of optimisation in one report. |
Best GA4 Reports for Marketing Analytics
Not all GA4 reports are created equal for marketing decisions. The six covered here are the ones practitioners actually use to change strategy — not just review performance.
The best GA4 reports for marketing analytics share three qualities. First, they answer a specific question rather than displaying a general overview. Second, they connect data to action — showing what to do, not just what happened. Third, they work together as a sequence rather than independently.
| If you want to know… | Use this GA4 report |
| Which channel drives the most valuable traffic | Traffic Acquisition — sort by key event rate |
| Which channels are growing your new audience | User Acquisition — filter by new users |
| Which content is worth writing more of | Engagement Report — sort by avg engagement time |
| Where your funnel leaks most | Funnel Exploration — check drop-off by stage |
| What journey leads converting visitors to your CTA | Path Exploration — start from conversion event and trace back |
| Which pages need a stronger CTA | Conversion Report — filter by low key event rate |
Common GA4 Reporting Mistakes Marketers Make
Knowing which GA4 reports to use is only half the job. Here are the four mistakes that undermine even the best analytics setup.
Watching sessions instead of engagement
Sessions tell you how many people arrived. Engagement rate tells you how many of them actually read what they came for. Chasing session growth while ignoring engagement rate is how you build traffic that does not convert.
Comparing channels by volume, not efficiency
Email might drive 800 sessions to Organic Search’s 8,000. But if email converts at 7.2% and organic at 4.1%, email produces more conversions per session. GA4 reporting that only looks at volume will always undervalue your most efficient channels.
Ignoring prior period comparisons
A number without context means nothing. 28,400 sessions this month — is that good? You need to know it was 24,100 last month to understand it is 17.8% growth. Always run GA4 reports with a prior period comparison enabled. The change matters more than the number.
Checking data daily instead of weekly
Daily GA4 metrics are noisy. A single viral post or a slow Sunday skews everything. A weekly review with a consistent date range gives you patterns you can act on. Daily checking creates anxiety. Weekly checking creates strategy.
How to Use These GA4 Reports Together
These six GA4 reports work best as a sequence, not as six separate tasks. Here is a recurring workflow that takes under 20 minutes.
Weekly review — 15 minutes every Monday
- Traffic Acquisition: did any channel drop or spike more than 15% versus last week?
- Engagement Report: check your top 5 traffic pages — did engagement rate hold or slip?
- Conversion Report: is your site-wide key event rate trending up or down?
- Note anything unusual. Do not react to a single week. React to a pattern.
Monthly deep-dive — 45 minutes
- Run Traffic Acquisition with a full month comparison — track channel share shifts
- Run User Acquisition — identify your strongest new audience channels this month
- Open Funnel Exploration — check where your conversion funnel leaked most
- Open Path Exploration — find any new pages appearing in converting journeys
- Update your GA4 reporting template with the month’s numbers
| Key principle: Each report answers one question. Traffic Acquisition answers where. Engagement answers how well. Conversions answer how much. Funnel Exploration answers where visitors leave. Path Exploration answers where they go instead. Read them in sequence and you have the complete picture. |
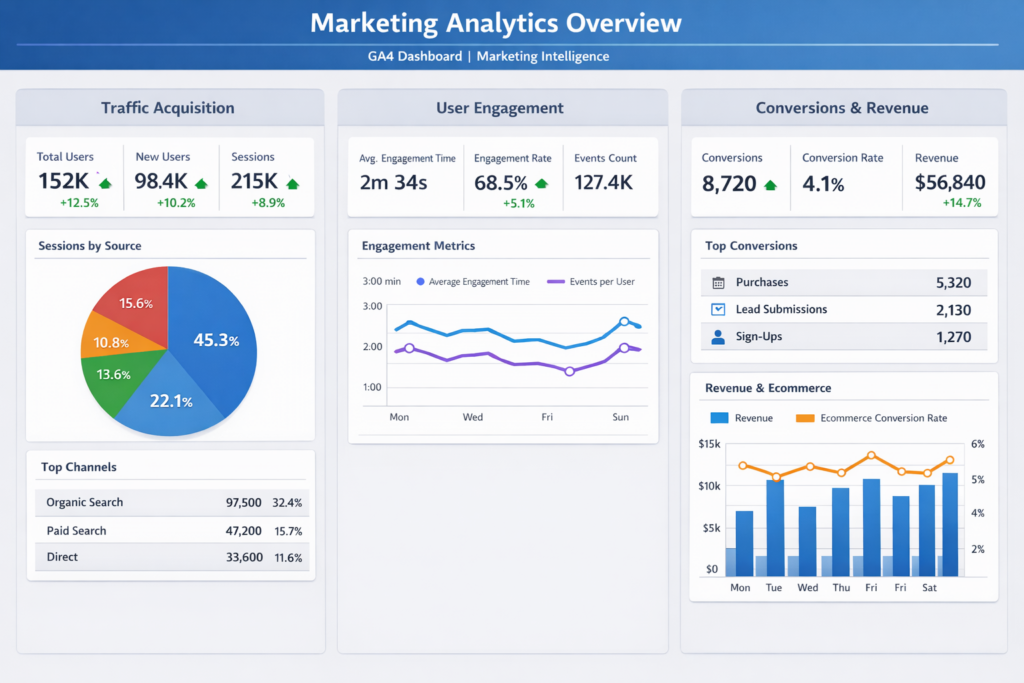
From GA4 Reports to Marketing Intelligence
These six GA4 reports show you the data. But they still require manual interpretation — pulling numbers, comparing periods, spotting patterns, writing down what to fix next. That process works. It just takes time you could spend acting on the insights instead.
Advanced marketers go one step further. They build dashboards that combine content scoring, opportunity identification, and channel ROI analysis into a single view. That turns GA4 reports into marketing intelligence — not just data.
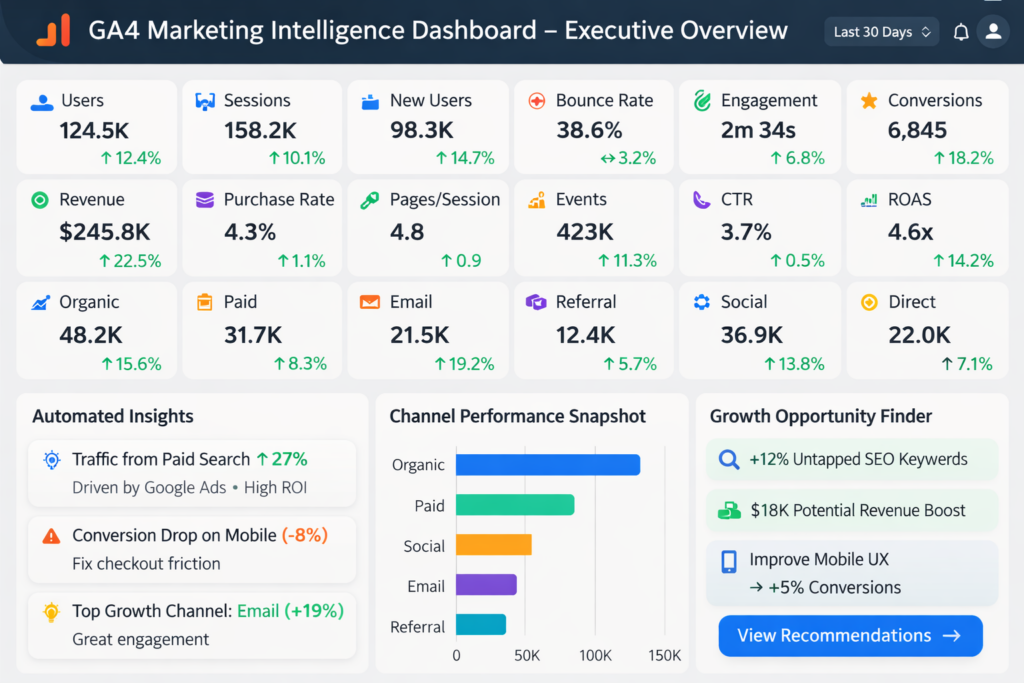
The GA4 Marketing Intelligence Dashboard brings all six reports into one place. Paste your GA4 export once and every dashboard updates automatically.
| Dashboard Module | What It Replaces |
| Executive Overview | Manual KPI tracking — 24 metrics with MoM arrows, auto-updated |
| Content Performance Engine | Manual engagement analysis — every page auto-scored and ranked |
| Growth Opportunity Finder | Manual conversion gap analysis — pages flagged with specific actions |
| Channel ROI Analyzer | Manual channel comparison — ROAS, CPA and ROI Score auto-calculated |
| Conversion Funnel Monitor | Manual funnel tracking — 7-stage funnel with drop-off and benchmarks |
| Monthly Trends Tracker | Manual month logging — 12-month tracker with live charts |
Four automated insight cards on the Overview sheet surface your top growth channel, your best content, your biggest quick win, and your strongest revenue source — updated the moment you paste new data. Instead of reading six reports and building your own analysis, you open one dashboard and act.
| The difference: Most GA4 dashboards show numbers. This one shows what to fix — with a specific recommended action for every flagged page and every underperforming channel. |
Free GA4 Reporting Starter Template
To make this weekly workflow easier to start, I built the GA4 Reporting Starter Template. It is free and takes under 10 minutes to set up.
What the free template includes
- 16-metric KPI dashboard — sessions, engagement rate, bounce rate, key events, lead rate and more
- MoM change indicators — automatically calculates growth vs prior period for every metric
- Weekly GA4 reporting checklist — the eight questions to ask every Monday morning
- GA4 export guide — exact click paths for every metric inside the template
- Single data input sheet — paste your numbers once, dashboard updates instantly
Download the free GA4 Reporting Starter Template — paste your GA4 data and have your key metrics tracked in under 10 minutes.
Ready for the full system? The GA4 Marketing Intelligence Dashboard adds content scoring, the growth opportunity finder, channel ROI ranking, a 7-stage conversion funnel, and 12-month trend tracking. Everything in the free template, plus the six advanced modules that turn your GA4 data into a decision engine.
| Get the full dashboard → GA4 Marketing Intelligence Dashboard (Excel Template)— Content Scoring + Opportunity Finder + Channel ROI. Available at ImpactfulIdentity.com. |
FAQs
What are the most important GA4 reports for marketers?
The six most important GA4 reports for marketing decisions are Traffic Acquisition, User Acquisition, Engagement, Conversions, Funnel Exploration and Path Exploration. Together they cover where your traffic comes from, how it behaves, whether it converts, and which journey leads to results.
What is a good engagement rate in GA4?
A good engagement rate in GA4 is 50% or above. GA4 defines an engaged session as one lasting longer than 10 seconds, including two or more pageviews, or resulting in a key event. Industry median is around 56%. Rates above 65% are strong for content sites.
Where is the Traffic Acquisition report in GA4?
In GA4, go to Reports in the left navigation, then Acquisition, then Traffic acquisition. Set your date range in the top right corner. The default view shows sessions by Default channel group — Organic Search, Direct, Referral, Email, Social, and Paid Search.
What is the difference between Traffic Acquisition and User Acquisition in GA4?
Traffic Acquisition tracks every session regardless of whether the visitor is new or returning. User Acquisition tracks only first-time visitors and attributes them to the channel that brought them for the very first time. Use Traffic Acquisition to understand ongoing engagement. Use User Acquisition to understand audience growth.
How do I track conversions in GA4 reports?
In GA4, conversions are tracked as key events. Go to Admin, then Events, and mark any event as a key event. It then appears in the Conversions report under Reports and Engagement. Set up key events for email opt-ins, form submissions, purchases, or any meaningful action on your site.
What reports replaced Universal Analytics in GA4?
GA4 reorganised reporting into lifecycle categories such as Acquisition, Engagement, Monetization, and Retention. The closest equivalents to Universal Analytics reports are Traffic Acquisition, User Acquisition, Engagement, and Conversions.
Start With One Report This Week
You do not need to master all six GA4 reports at once. Open Traffic Acquisition. Spend 10 minutes in it every Monday for a month. Watch which channels grow and which shrink. Notice the engagement rate differences between them.
Then add the Engagement Report. Find your highest-traffic, lowest-engagement pages. Fix one. Watch what happens the following month.
Build the habit before you build the system. Six GA4 reports, used consistently, will tell you more about your marketing than 30 reports used once.